Using Apple Notes as an accessible graphing calculator
Starting with the basics
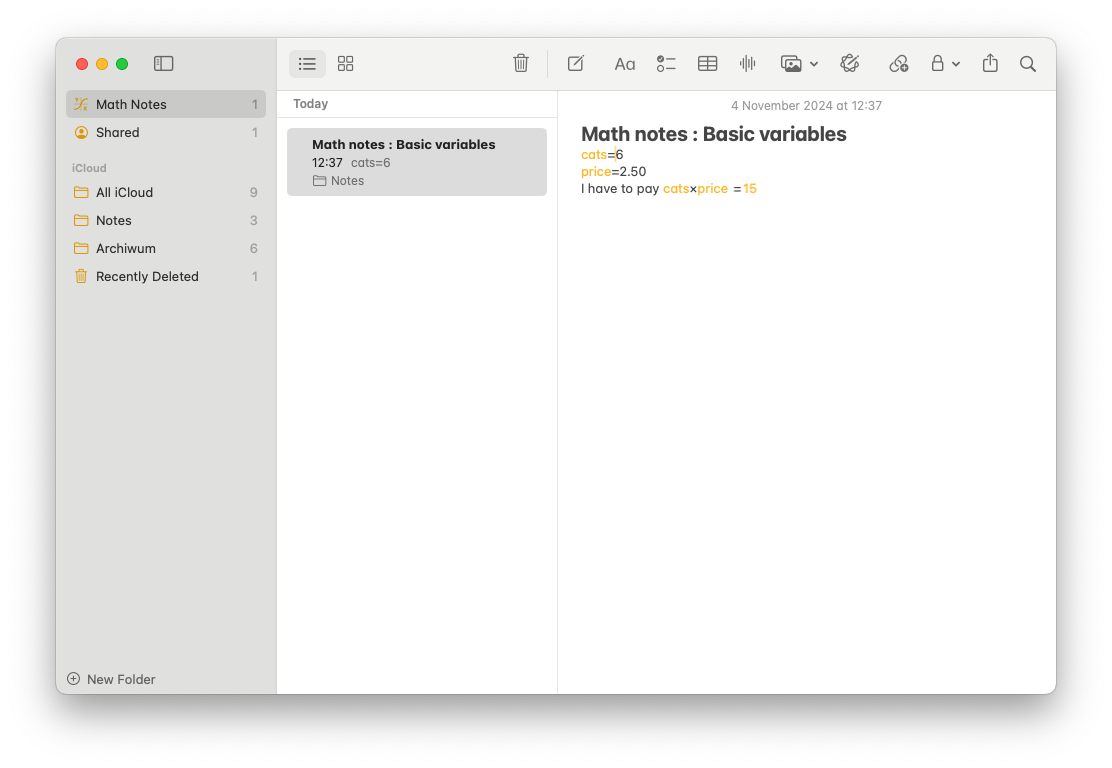
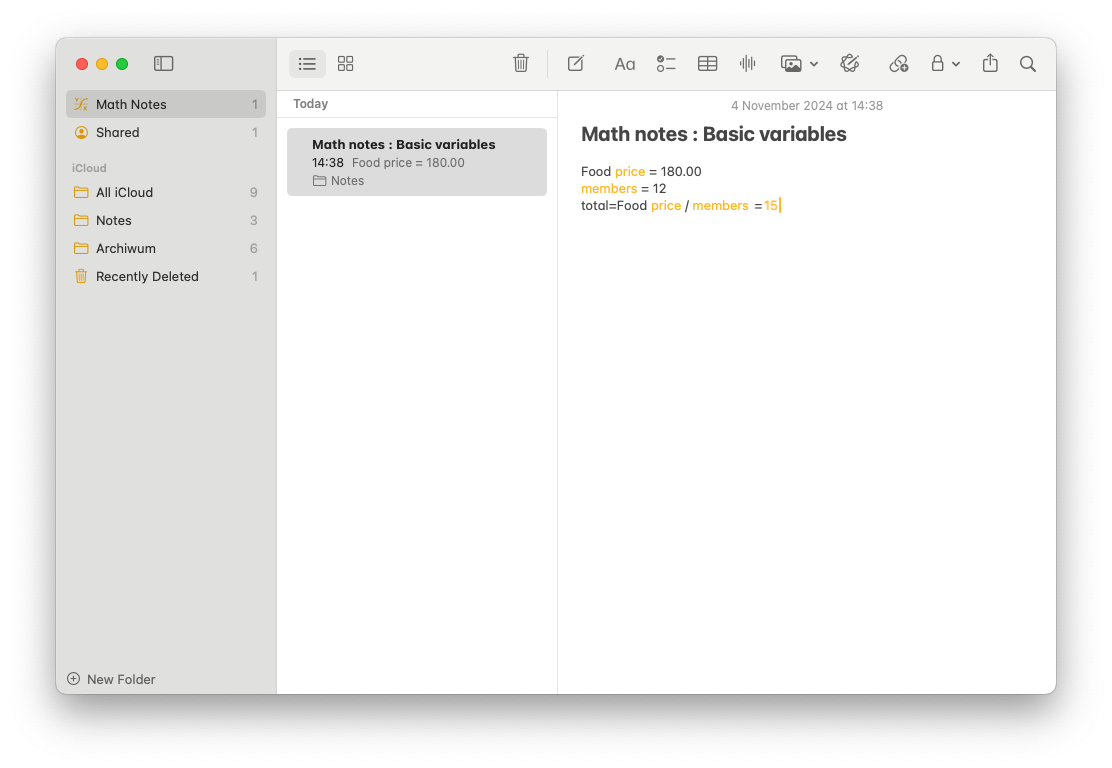
With the release of their latest batch of operating systems Apple made some substantial updates to both the Calculator and Notes app. I am not even saying about bringing an official Calculator to the iPad for the first time but more a feature called Math Notes which lets us, as the name implies create notes with math expressions inside them. For starters, we can define variables and perform calculations on those variables.

The best thing is that there’s no magic in all of this. You can use natural language to describe your variables. There are no hard rules of naming them like in programming.

However that’s not everything. We can use the exact same app to graph equations.
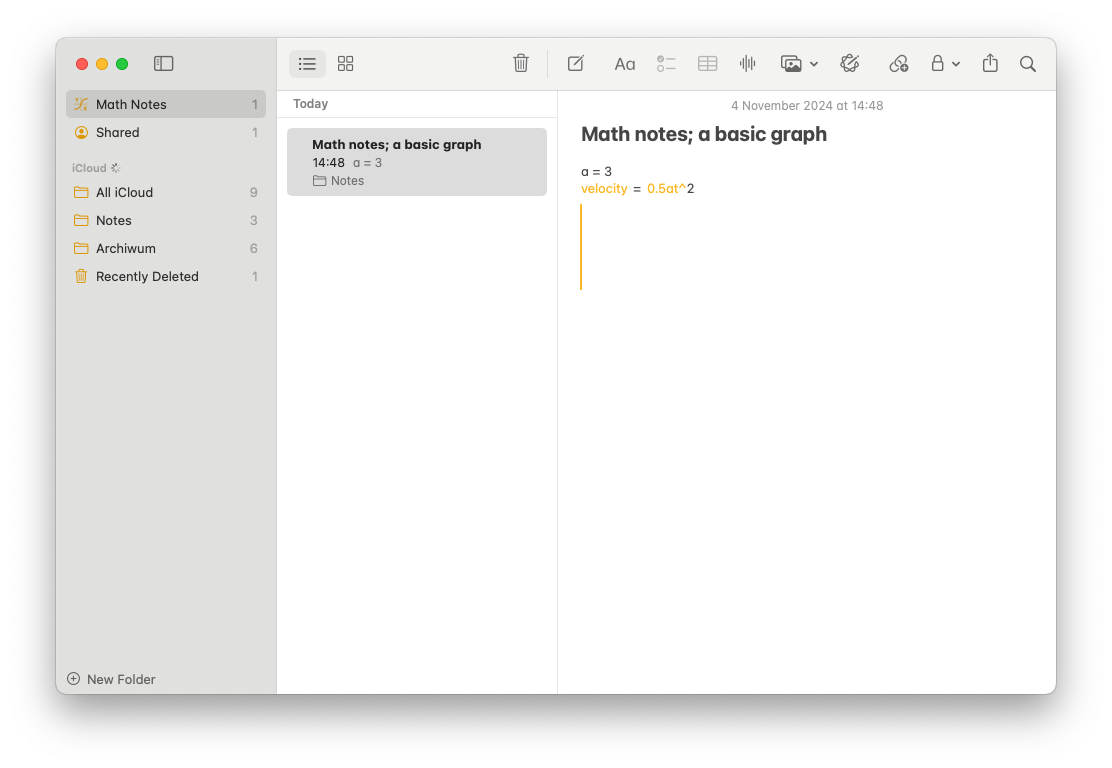
If we type, for example and then use rotor menu on our iPhone, we can find an option „Insert graph”. Double tapping it will insert a graph next to our expression.

For all fans of the Mac out there I have some bad news. For some reason it is very hard, if not impossible to insert a graph with VoiceOver. My tip is to write out your equation on a Mac and then use an iPhone to insert a graph. Then, going back to the Mac you can explore the graph as you would do with any Swift chart graph.
Exploring our graphs with VoiceOver
When the system finishes drawing the graph we can use standard VoiceOver’s commands to explore it. Of course some graphs can be infinite, hence only a part of the graph is shown at the same time.
- If you want to play your graph, navigate to it and switch your rotor to „Audio graph”. Then, swipe down to „Play the graph” and double tap. All going well you should hear your creation where the stereo panning determines X axis, Y axis is shown by a pitch change in the sound.
- You can also double tap and hold on the „Play graph” option. Doing that will put you in exploration mode, where you can drag your finger across the screen horizontally and feel the values under your finger. If you stop for a moment, VO will announce current axes and their values. Of course it is much nicer to use an iPad as you have much bigger working estate.
- You can use „Graph details” option to get a textual description of the graph. You can see whether data corelates, whether there are isolated values and what the general trend is.
- You can zoom in and out of the graph. Zooming in will give you a bit more detail on a smaller range of values while zooming out will give you a bird’s eye view. You will see more values but with less detail.
- You can always go back to default zoom level by selecting an appropriate option from the actions rotor menu.
How does it relate to other accessible graphing tools?
Over the years we had some accessible graphing calculators, some more sophisticated than the others. The most obvious choice was Desmos which I still consider to be an excellent piece of software. However its obvious drawback is that it requires constant Internet connection to function which can easily rule it out as a tool at school or university in some situations. Then we had some prototypes such as this but its Windows only, or the new kid on the block written in Go. The problem with those tools is that they have a pretty high entry level and I can’t imagine myself at a mainstream high school with a final exam approaching trying to figure out why the hell a given piece of software doesn’t want to compile.
Epilogue
I hope you found this article useful and I hope even more that thanks to it you won’t struggle at math as much as I did. Let’s make math accessible to everyone!